CATABus transit system map
CATABus Operations Improvement Report
individual independent project | 2019
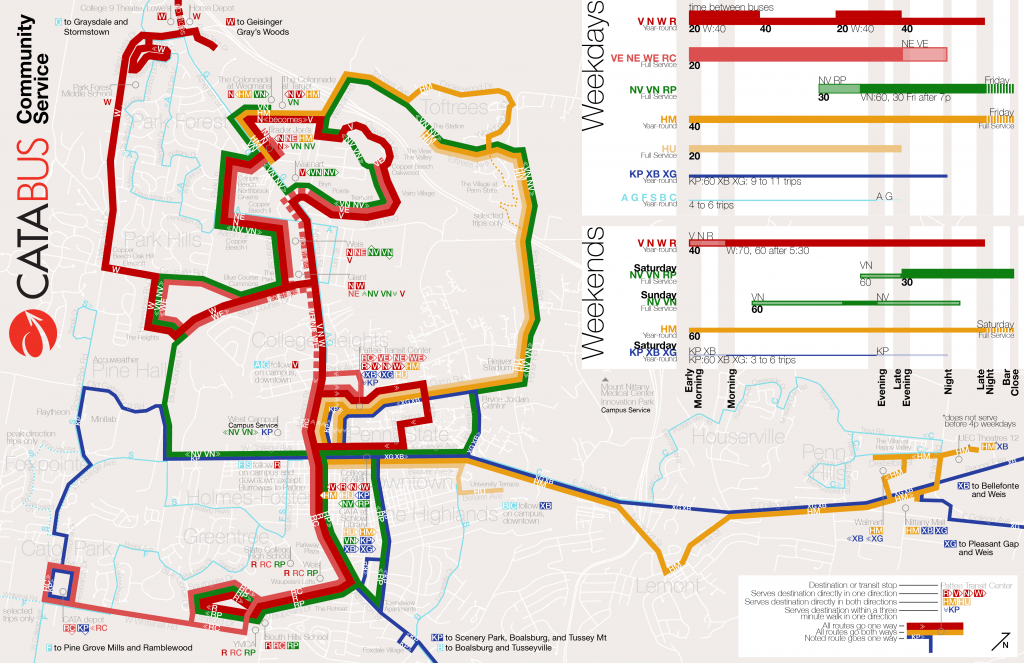
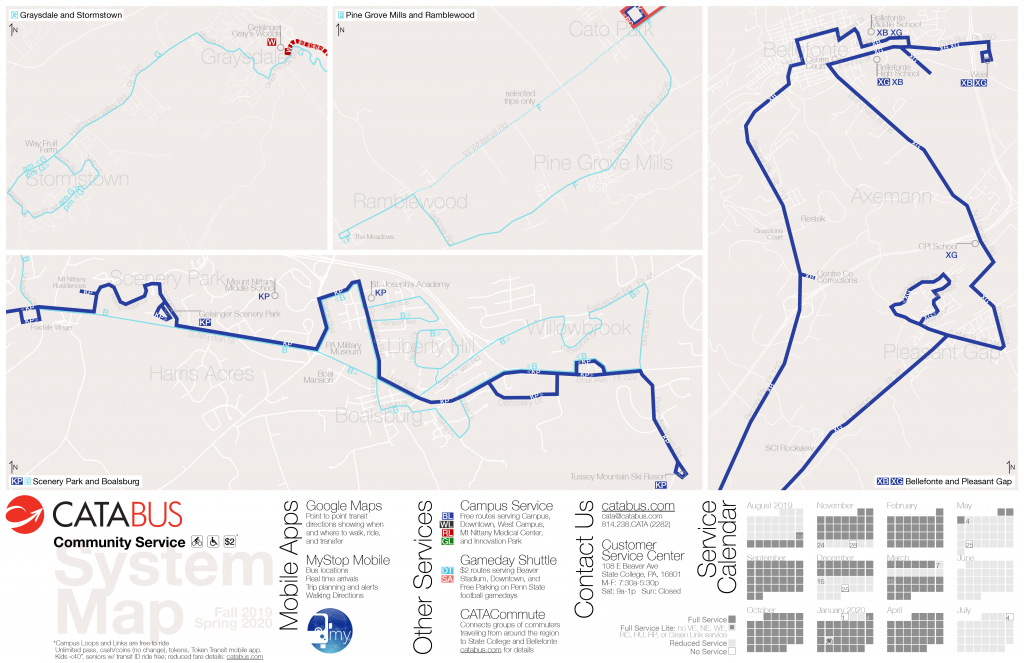
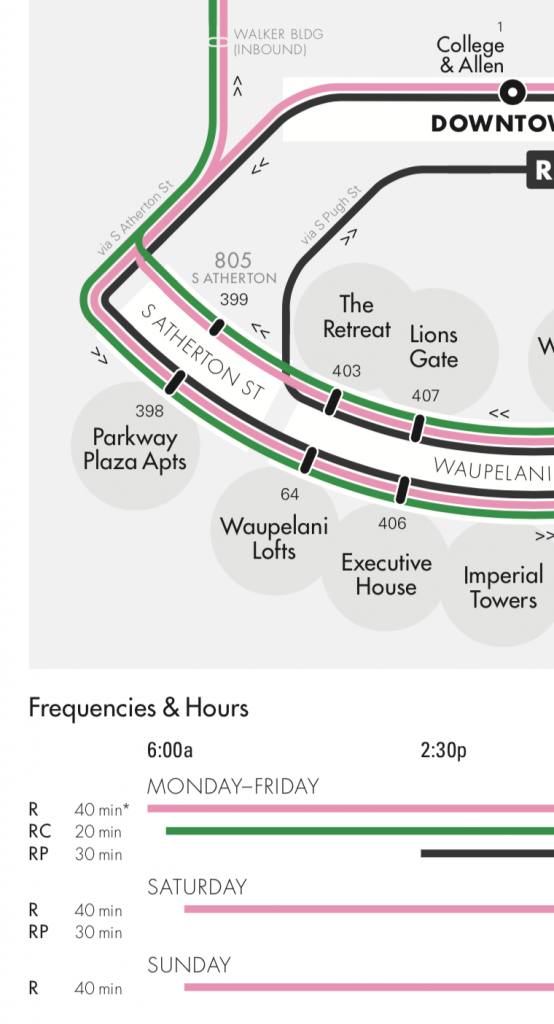
New system map showing simplified route frequencies and spans
This 11 x 17 inch double sided transit map is the latest map I’ve made of the CATABus transit system in State College PA. It is created in Illustrator, with a basemap taken from ArcGIS. This is the latest of almost a dozen maps of the CATA system I’ve designed, at first created on Inkscape during a CATA internship and later rethought on Illustrator as an independent project. This map is included in the Network Legibility section of the CATABus Operations Improvement Report.
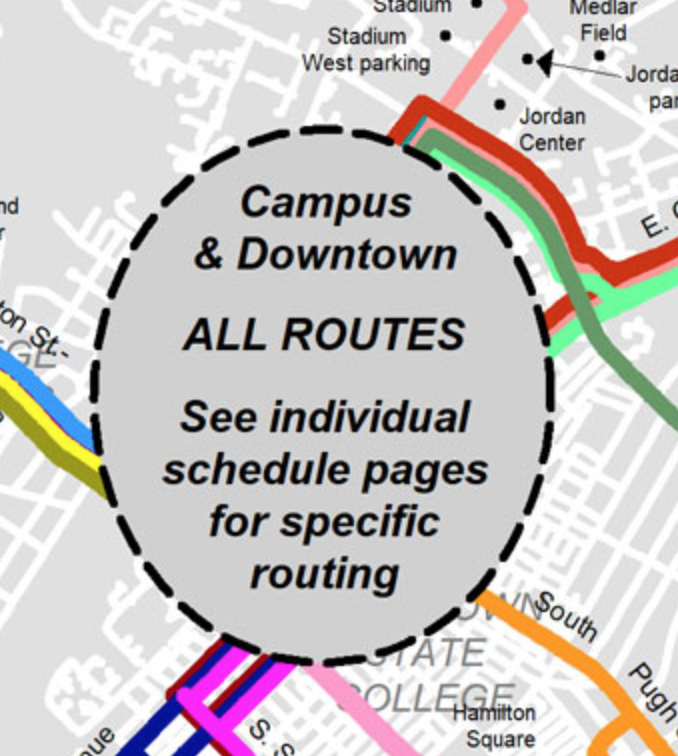
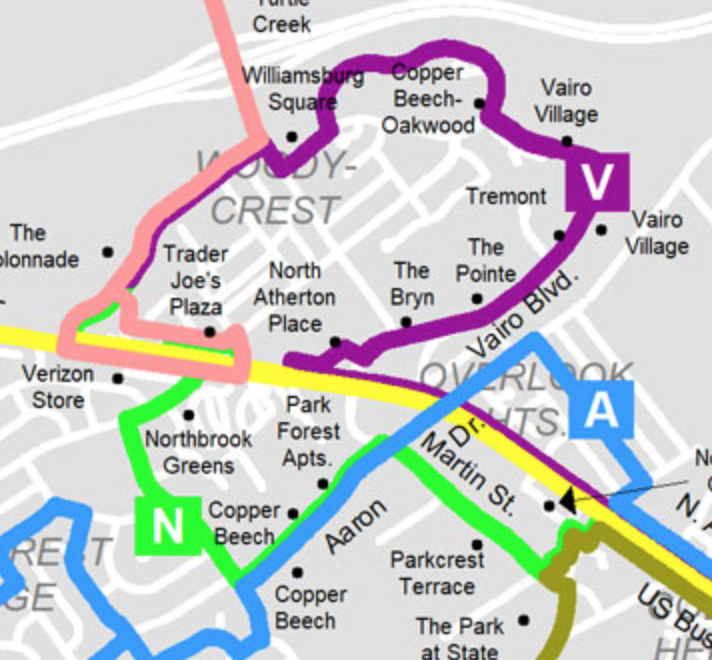
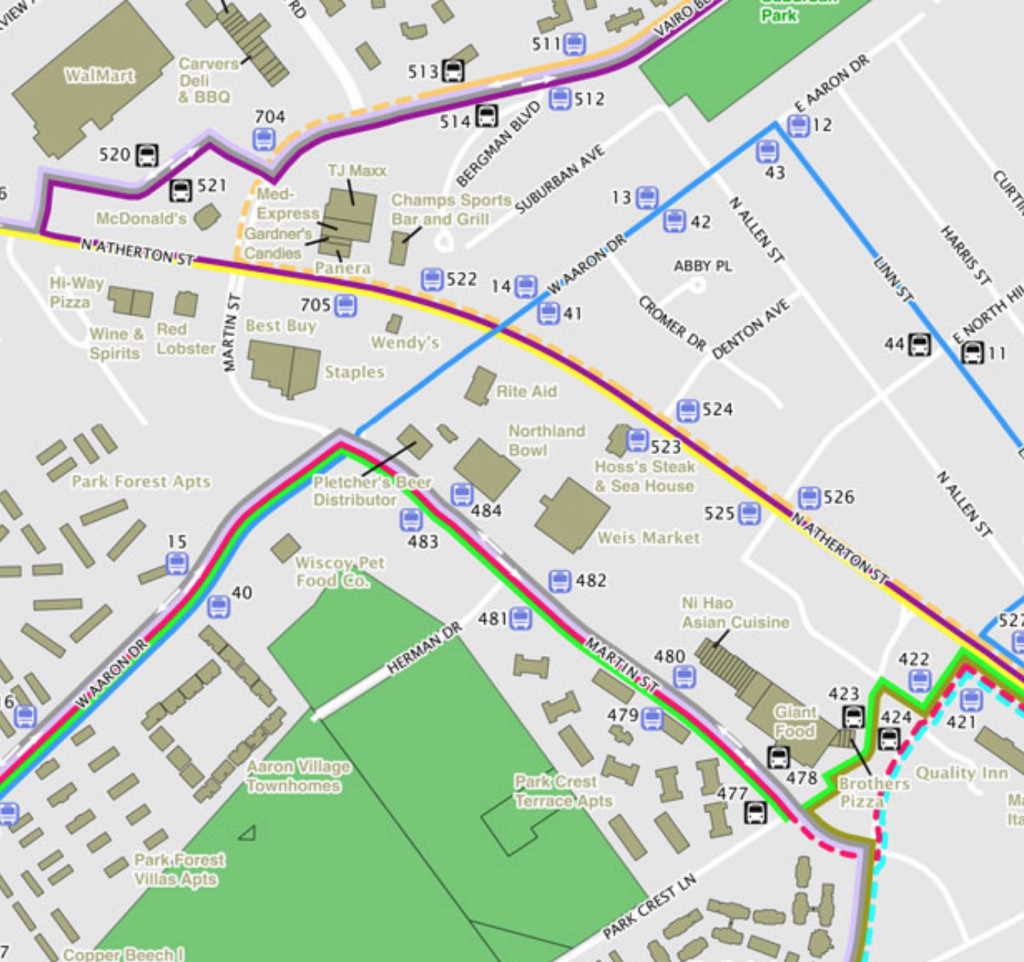
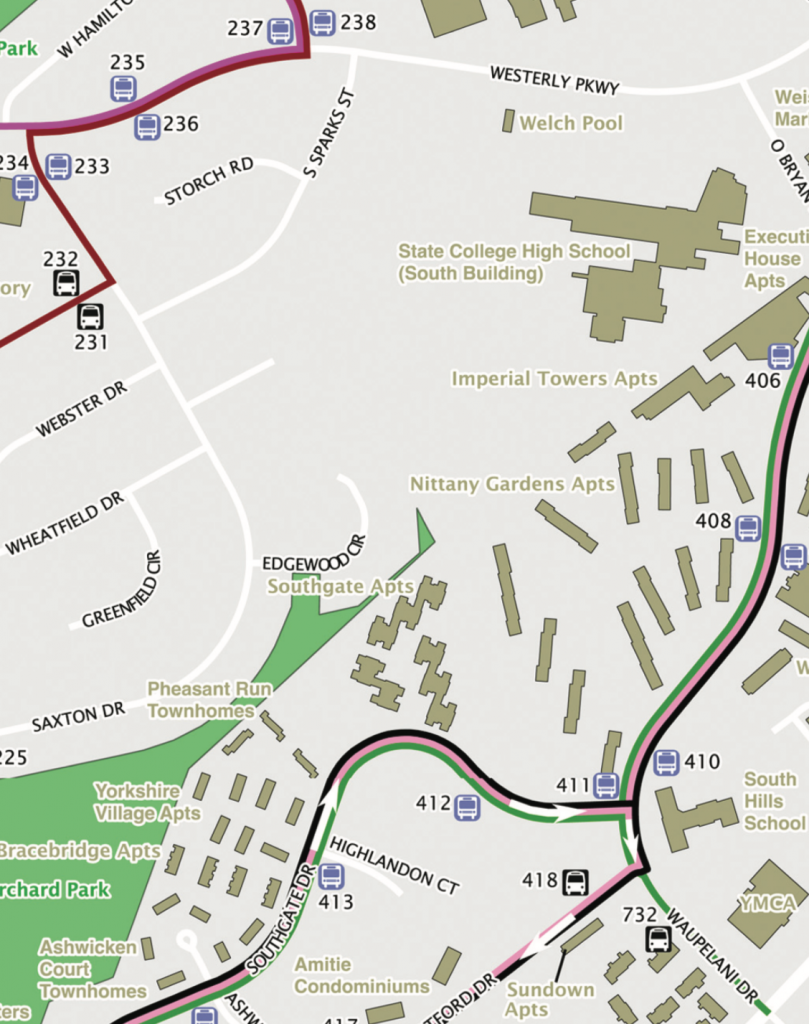
Current system maps lacking frequency differentiation and showing superfluous information
CATABus stop information signs
CATABus Operations Improvement Report
individual independent project | 2019
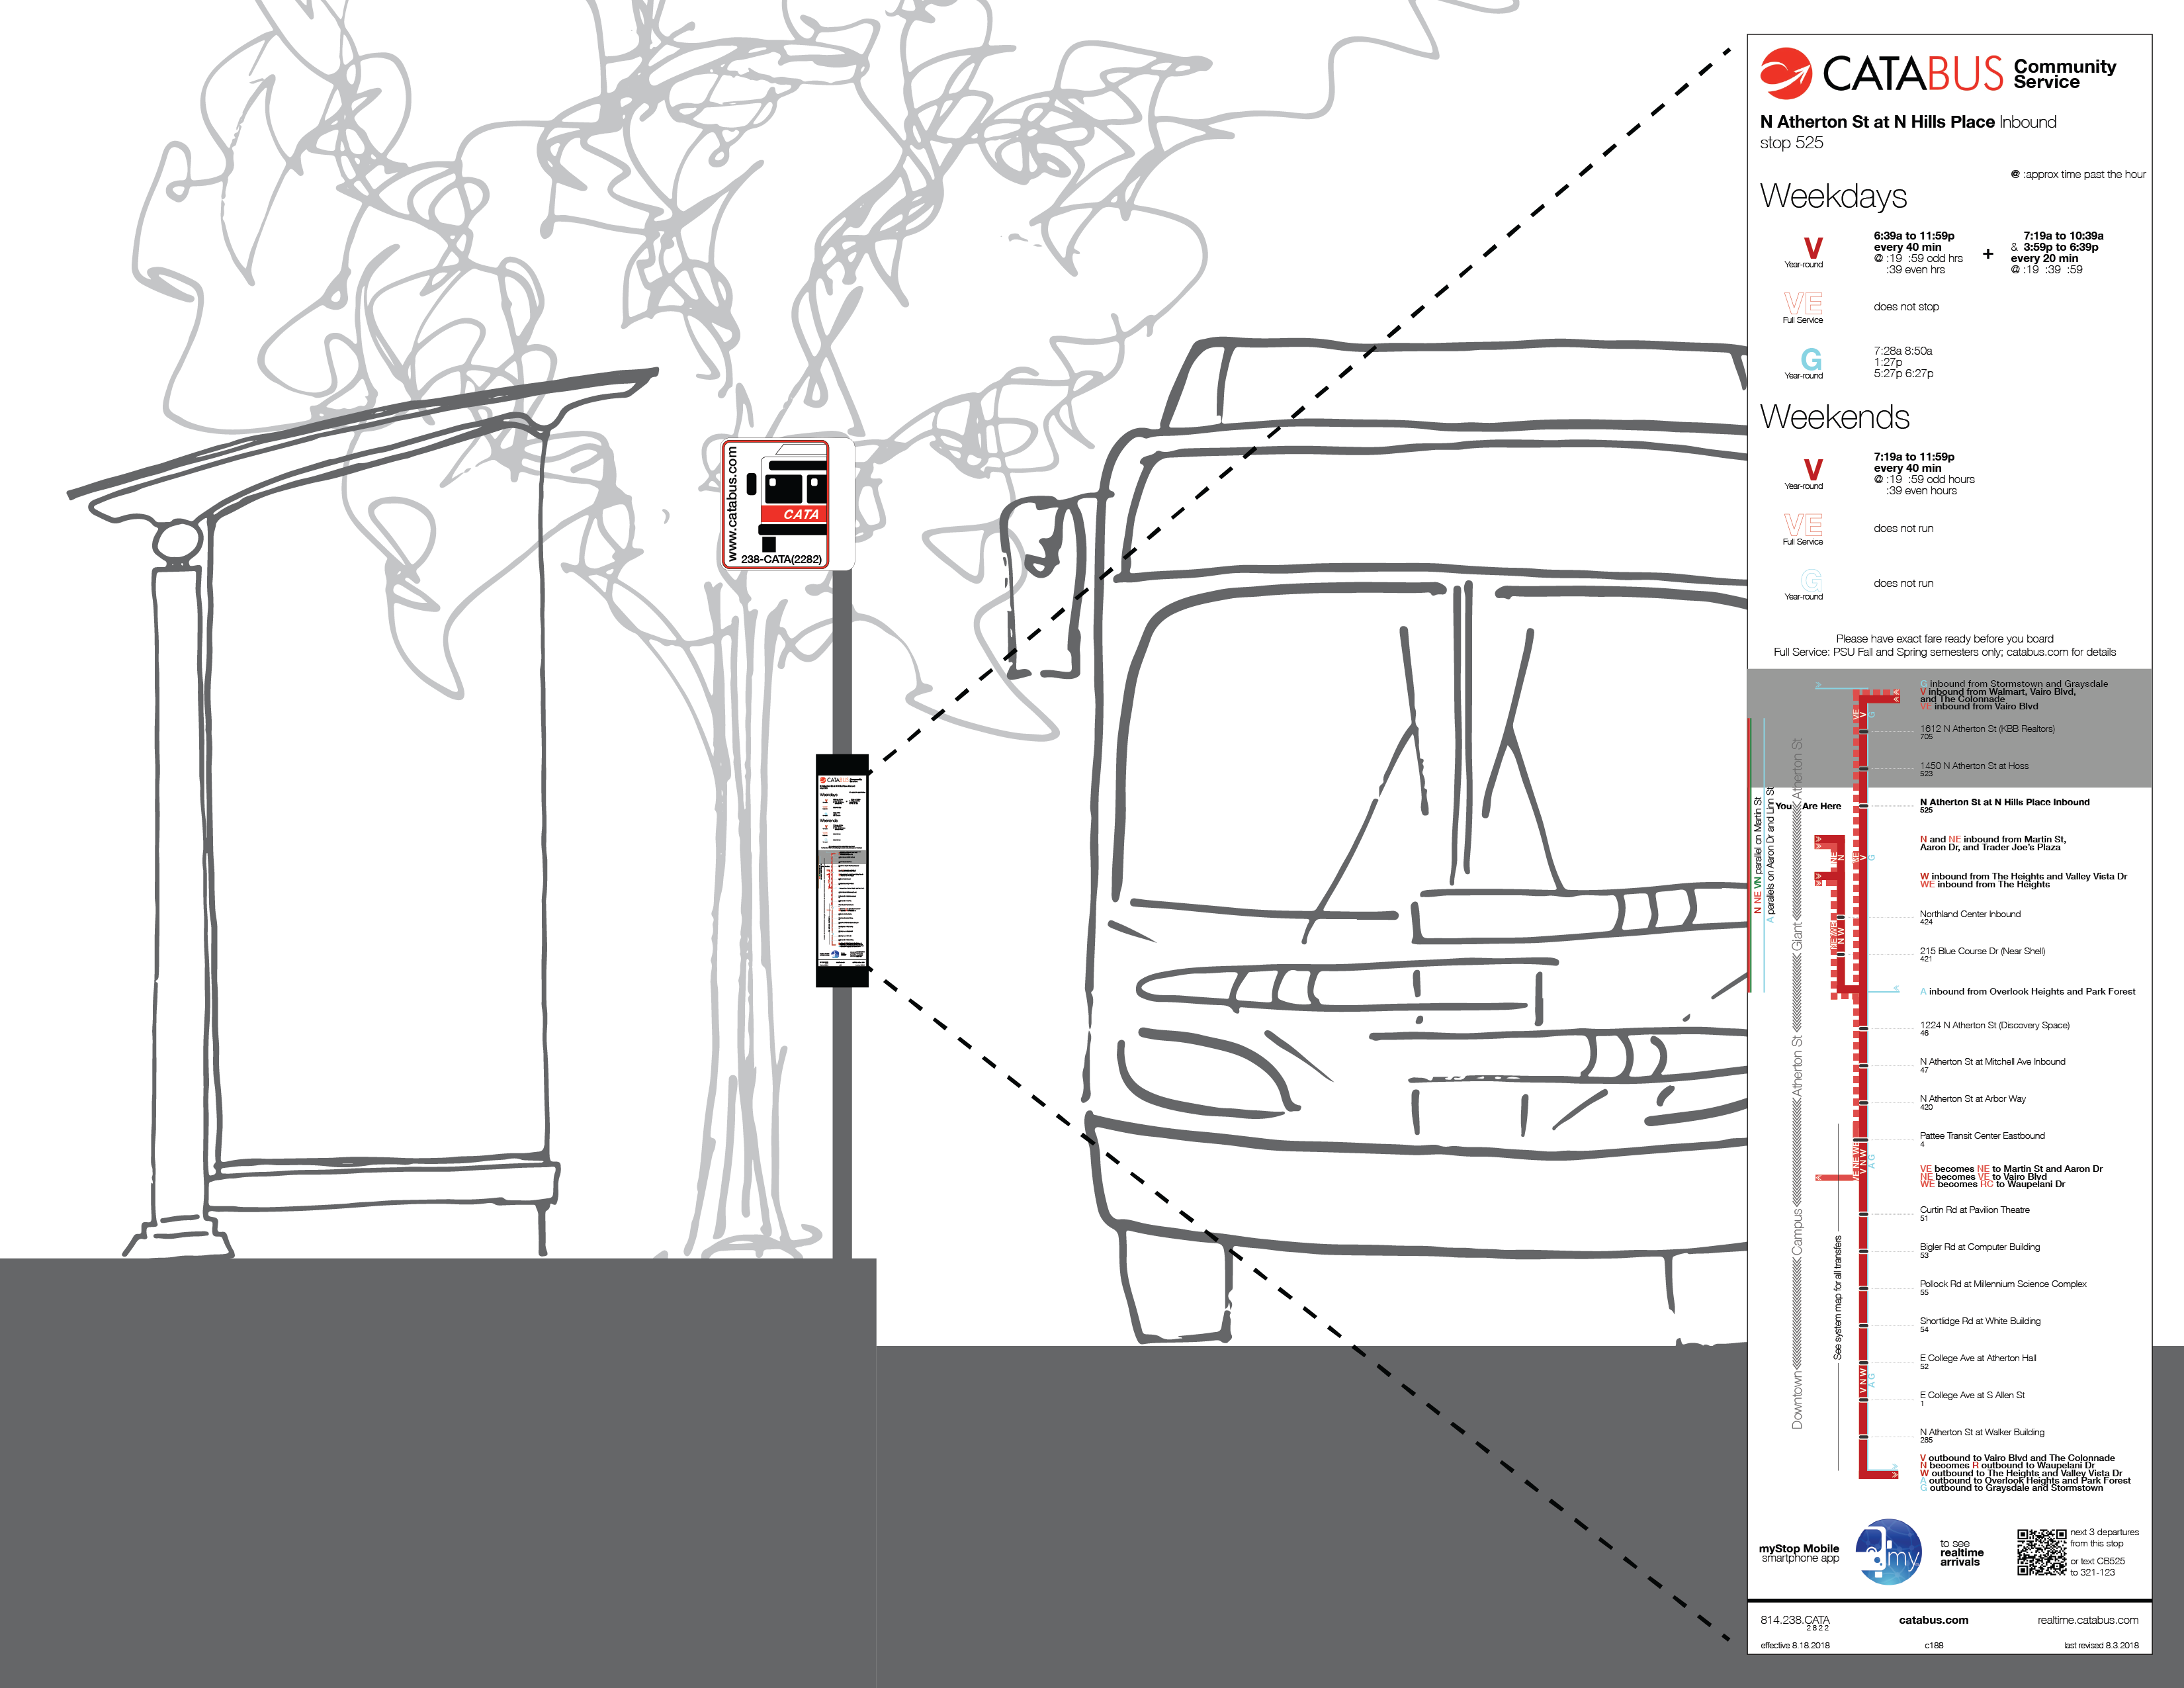
These information signs would be posted at CATA bus stops to display route and frequency information to customers waiting to board the bus. These eight signs are samples of the hundreds which would need to be produced for each bus stop: the next step of the project is to use GTFS data to create frequency explanations which can be fed into illustrator templates as variables. These stop info signs are included in the Network Legibility section of the CATABus Operations Improvement Report.
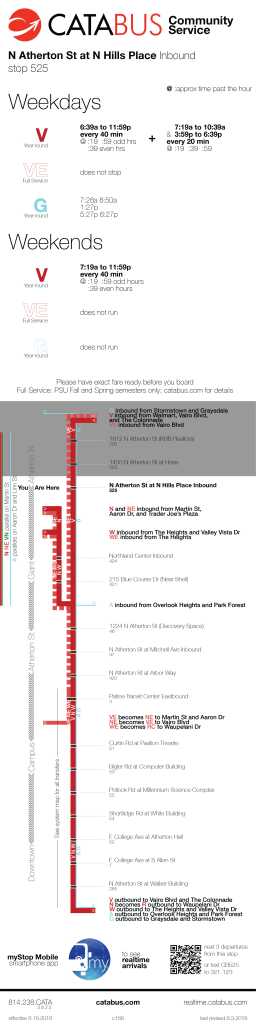
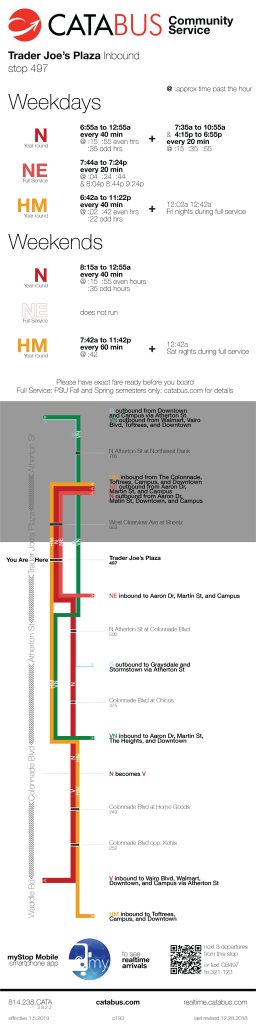
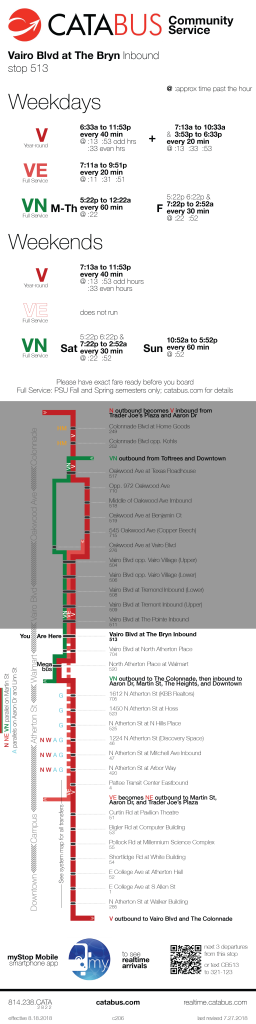
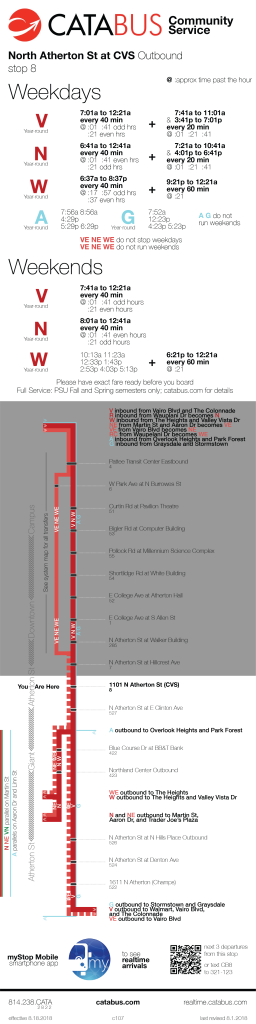
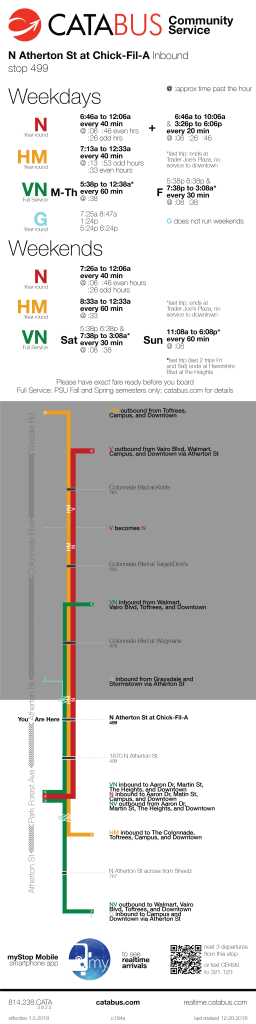
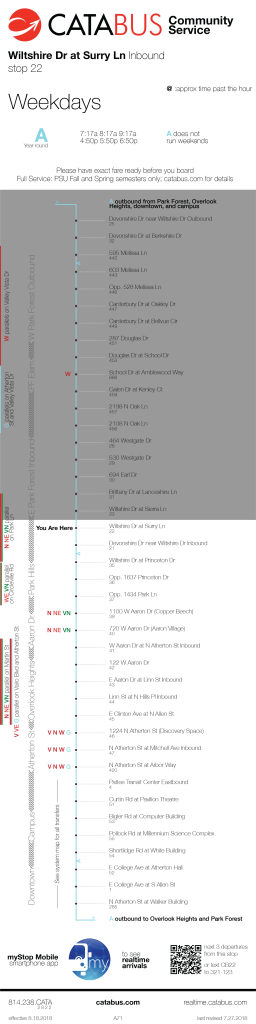

Proposed route, timetable, and frequency stop information signs
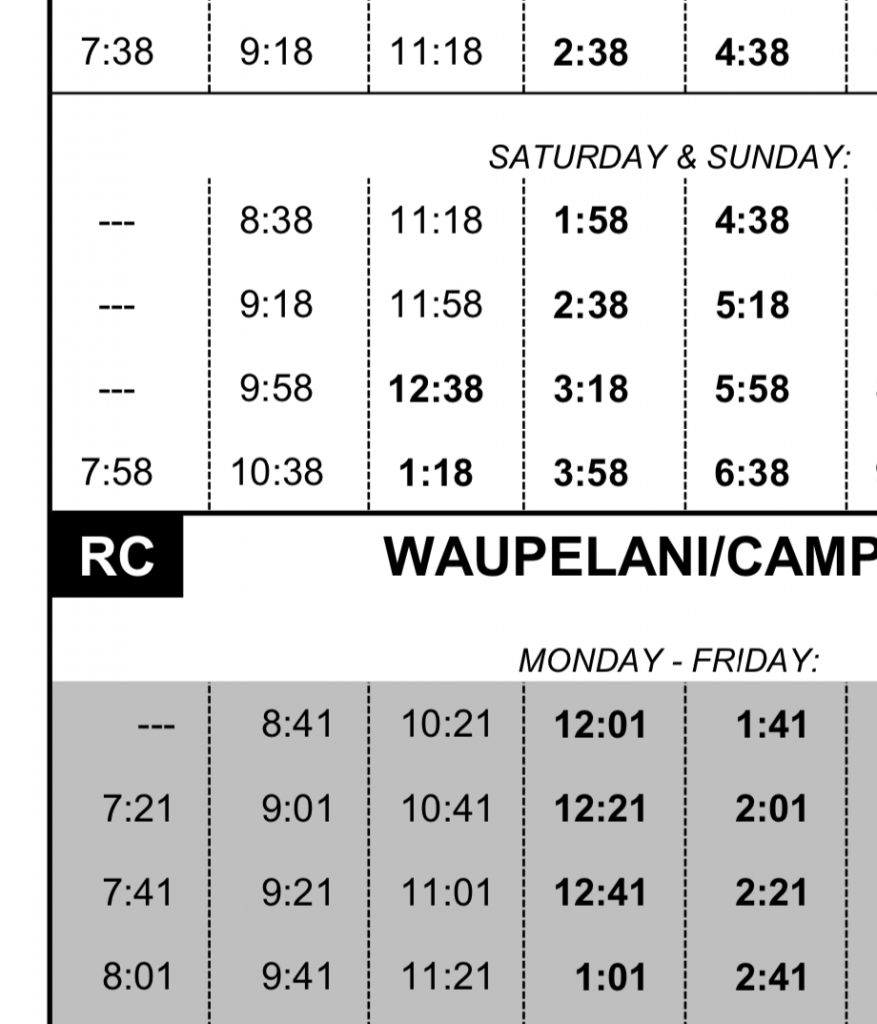
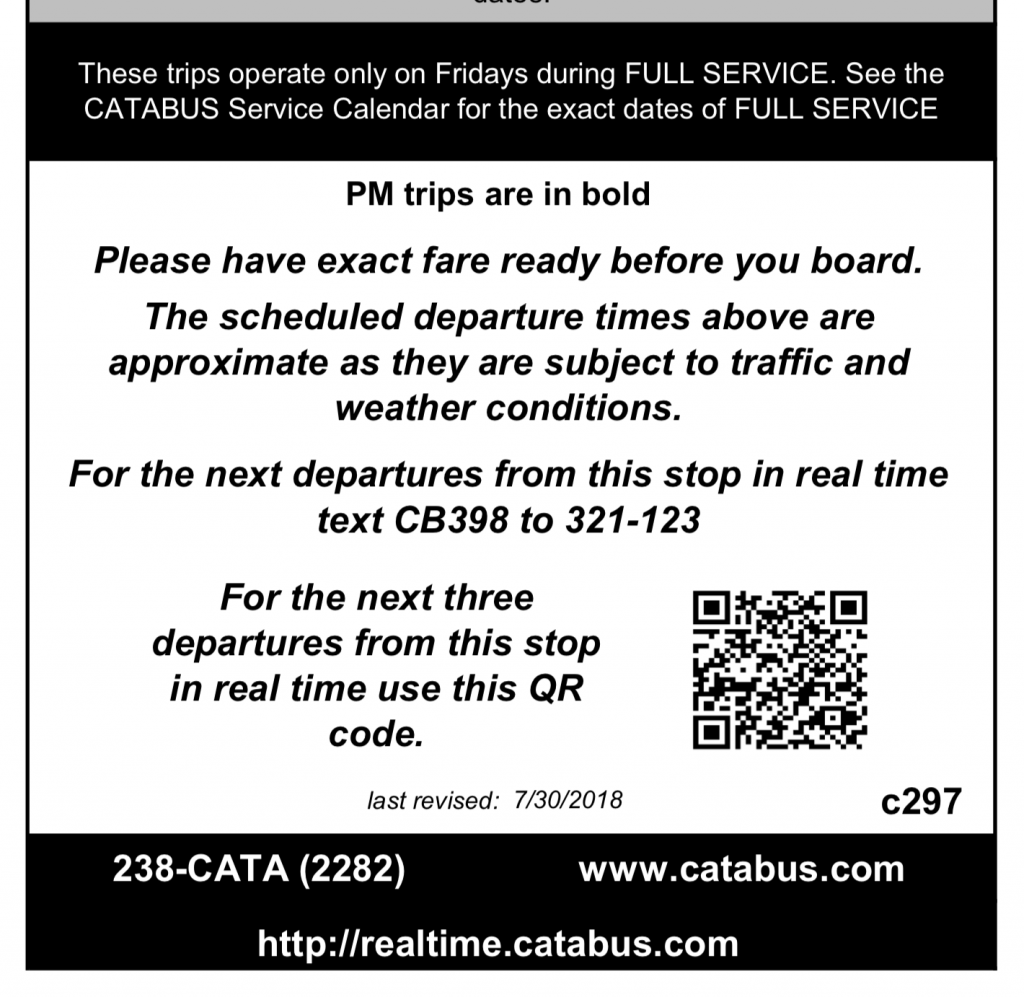
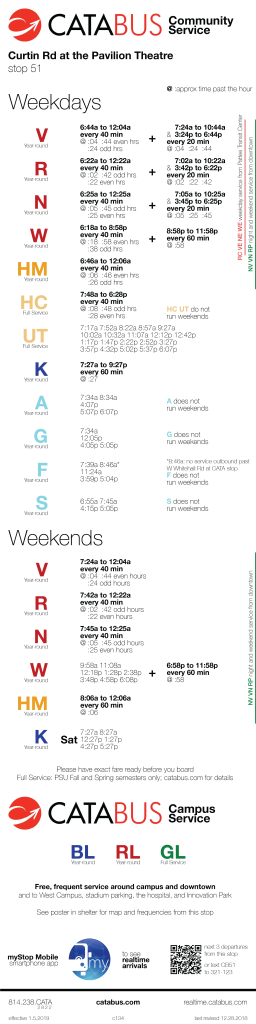
Current timetable and frequency information
University Drive recommended street section
Downtown East Redevelopment
ced 409 individual independent project | 2020
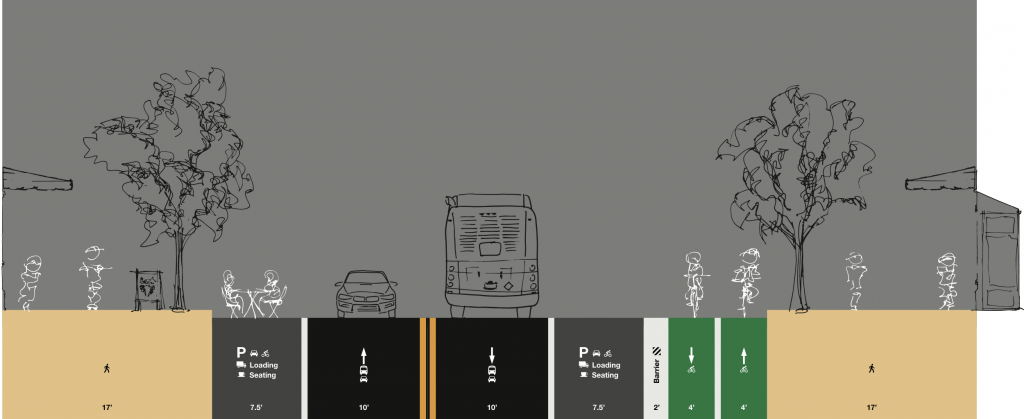
This street section was created in Illustrator showing the multiple uses of a complete street. The vehicle, pedestrian, and object entourage was created as hand-drawn sketches, image-traced in Illustrator. This drawing shows the Complete Street elements proposed for University Drive in the Street Design section of the Downtown East Redevelopment.
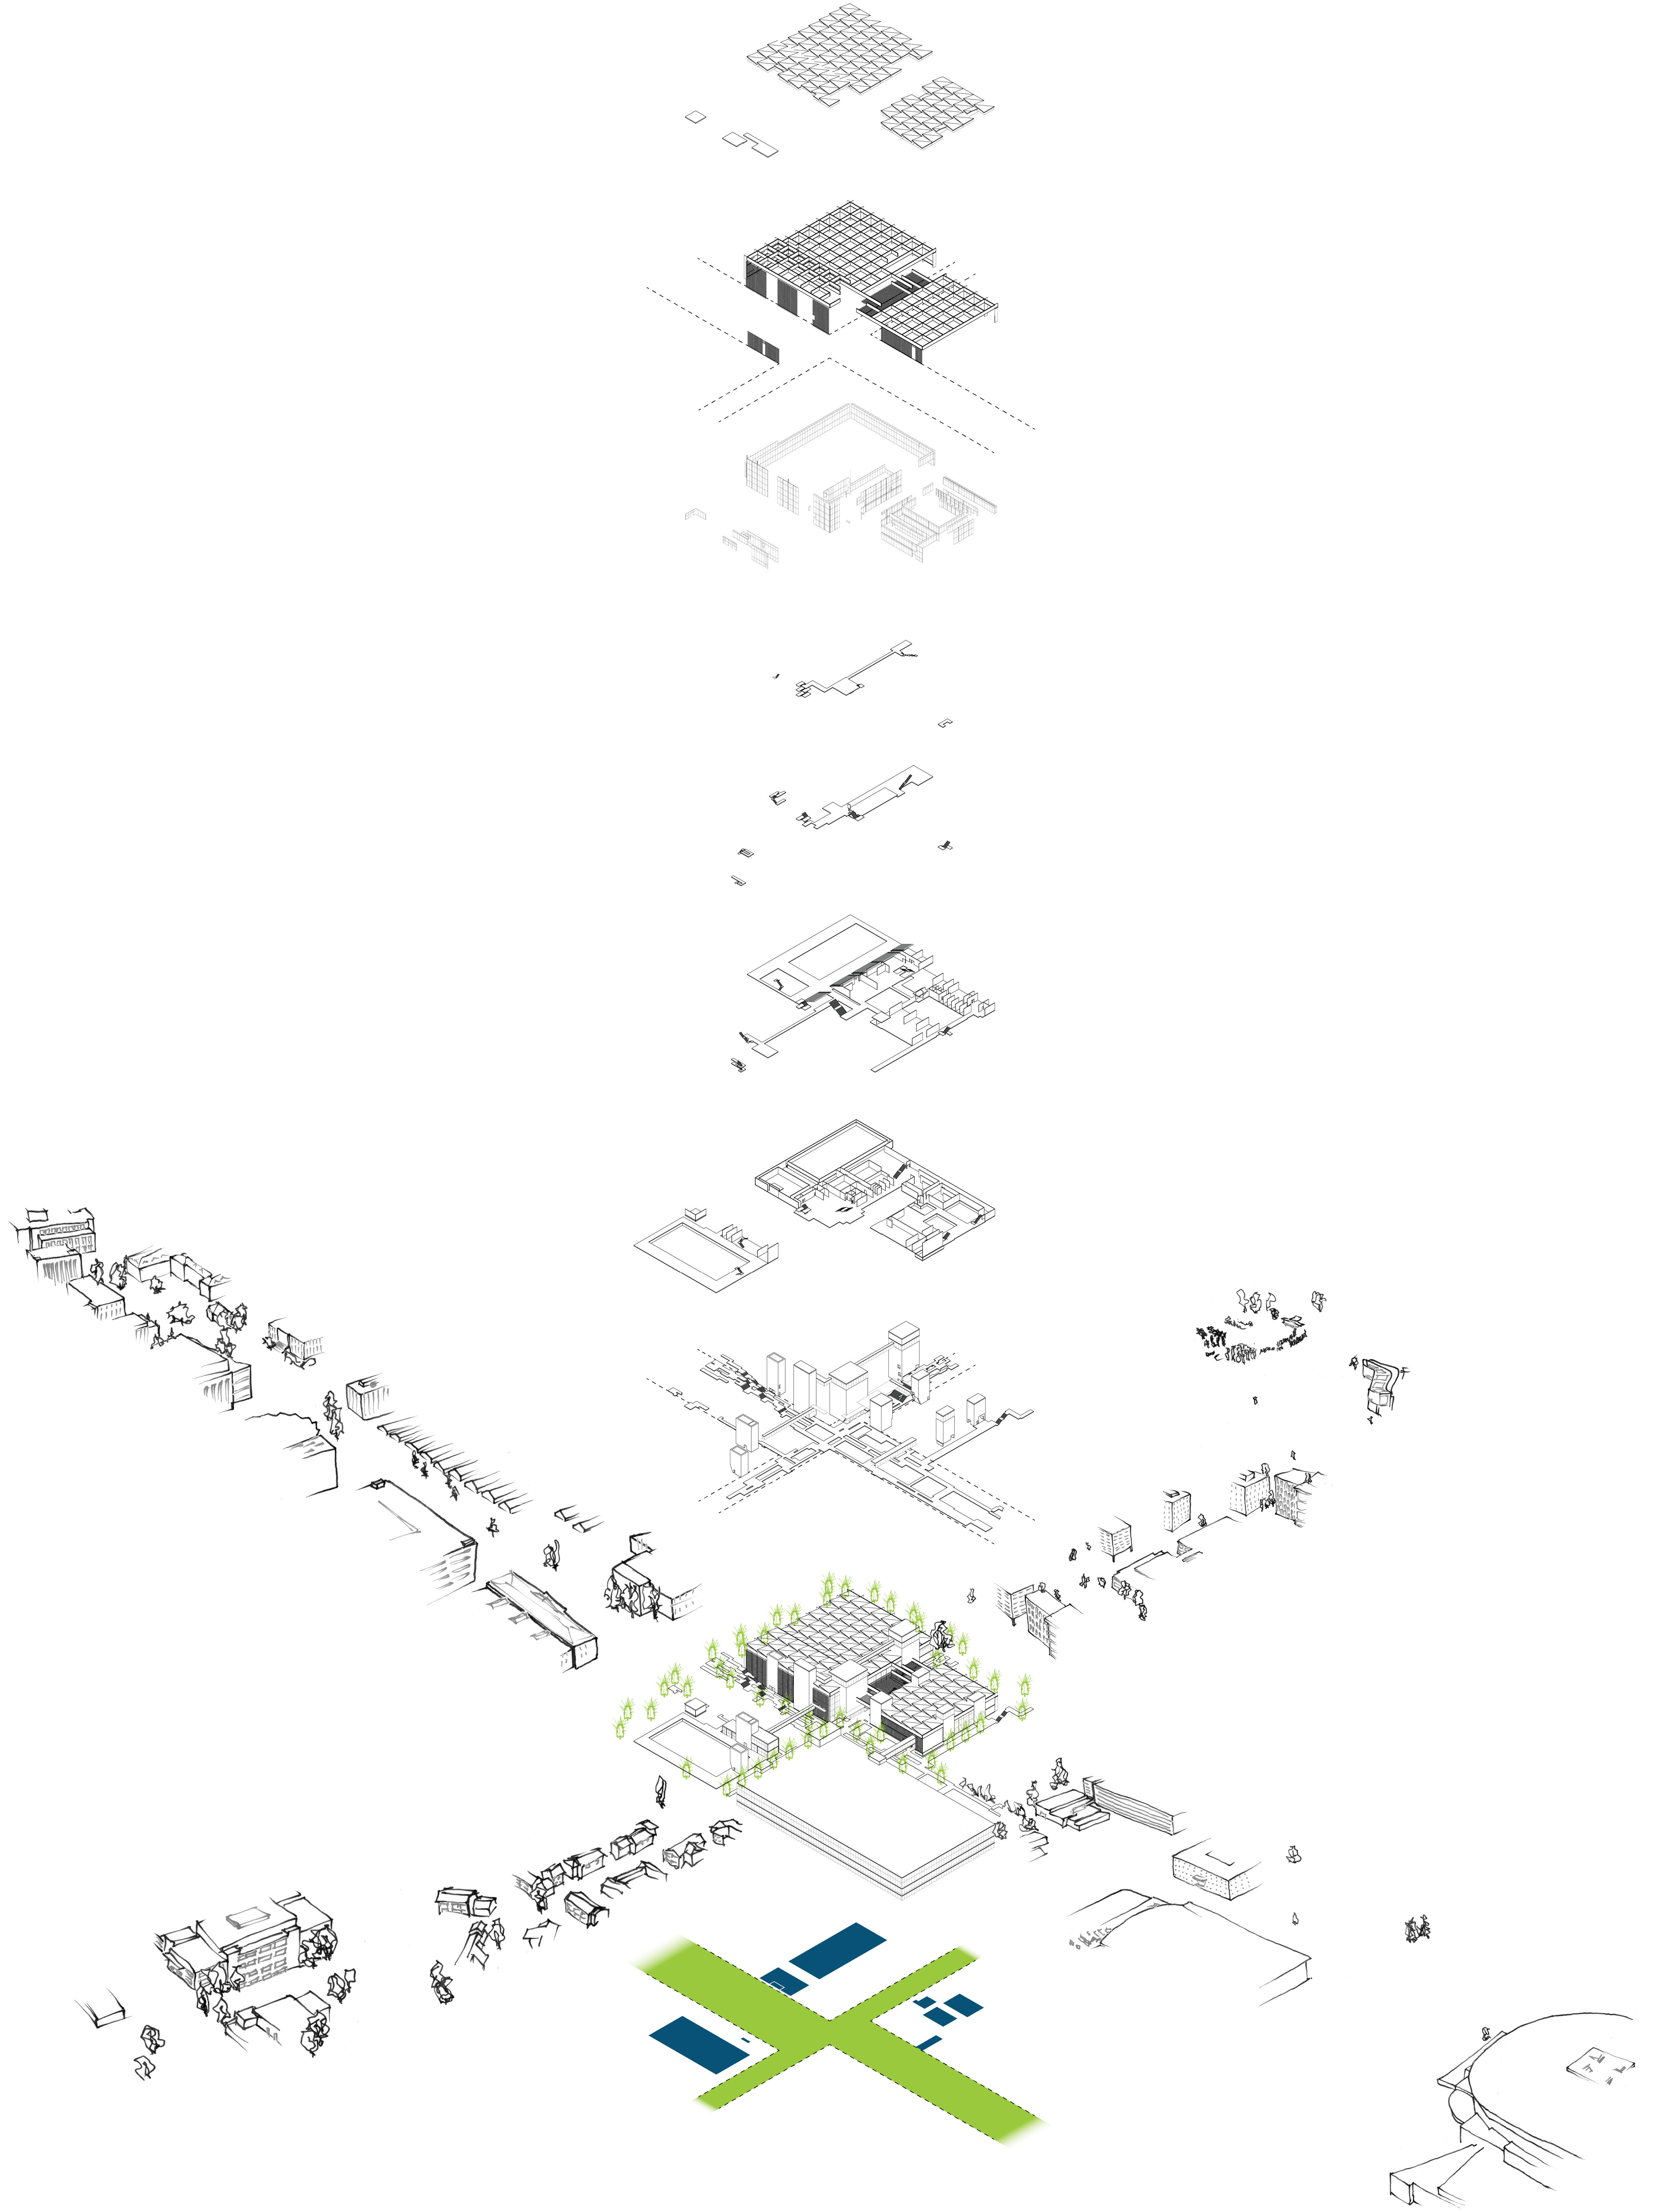
Urban context exploded axonometric
Penn State Natatorium
arch 331 individual studio project | 2018
I often import line data from architectural drawing software such as Revit and Rhino into Illustrator for formatting. Additionally, I use Photoshop to add context and texture, and Indesign to combine drawings into a unified project ‘board.’ This is an exploded axonometric drawing created in Revit, formatted in illustrator with image-traced scans of hand-drawn context. This drawing shows my design for the Penn State Natatorium as an extension of its urban context.